
The scale of the current isovalue appear in the down left of the Analysis window. The current isovalue and the unit are remembered above the scale.
The histogram of the picture appear on the scale. It is a curve representing the distribution of the isovalue. The mean value of the isovalue is marked with a vertical red line on the scale.
The minimum and maximum values of the scale can be changed. To do so, click on the value you want change and the following window will appear :
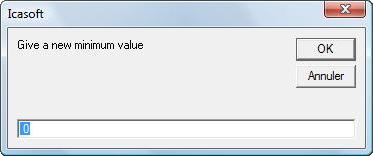
Enter the new value and click on the OK button.
You can also change the value by choosing it on the scale. Click on the value you want as minimum or maximum. On click, line will appear in the scale with the corresponding value.

Then click on the value you want change (Minimum or maximum value) and the following window will appear with the selected value :

Click the OK button to accept the new value.
If a value is out of the range of the scale it appear in bleu on the picture. If the check box on the upper right of the scale is ticked  , the values out of range will take the color of the highest/downiest value of the scale :
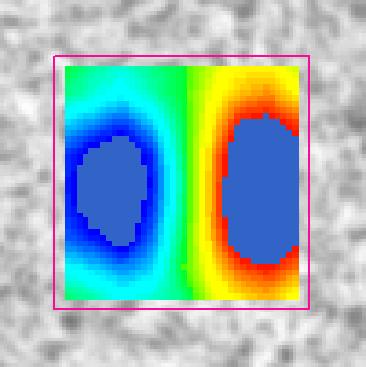
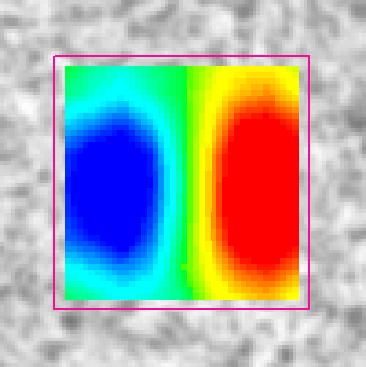
1 displacement with values out of the scale range without the appearance option (left) and with the appearance option (right)
The scale options appears in the down right of the Analysis window.
The scroll bar on the left allow to change the number of colors used in the scale. When the scroll bar is up, there are only three colors, when it is down there are 256 colors in the scale.
The three radio buttons on the middle allow to select the scale coloration mode :
Classical : default scale varying from blue to red 
Grey Level : scale in grey level 
Enhanced : scale with more colors than the classical one 
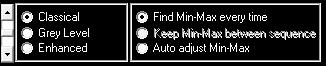
The three radio buttons on the right refers to the min-max options :
Find Min-Max every time : for every result Icasoft chose the minimum and maximum values as minimum and maximum for the scale,
Keep Min-Max between sequence : when analyzing a sequence results the scale is kept from one picture to the other,
Auto adjust Min-Max : in a sequence, find the absolute minimum and maximum values in the sequence and take it for the scale.