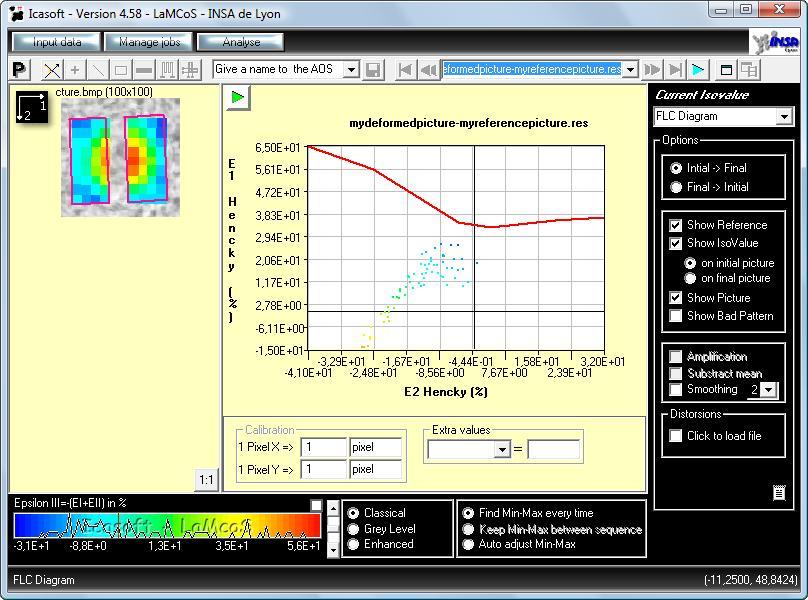
To analysis correctly the FLC, you have to chose the option Final–>Initial.
The isovalue FLC Diagram will show you the Forming Limit Curve plot that represent E1 Hencky major strain versus E2 Hencky minor strain in % :

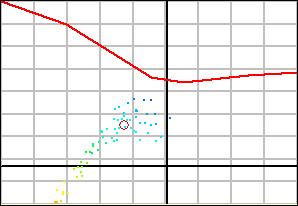
The red curve is the Forming Limit Curve. The Dots represent the isovalues of the picture. If you click on the picture, Icasoft will show you the representation of the point you have just clicked on in the FLC Diagram by drawing a red round around the dot :

Display of a value selected on the picture (red circle)
If an isovalue is higher than the FLC, it means that the material will crack at this point.
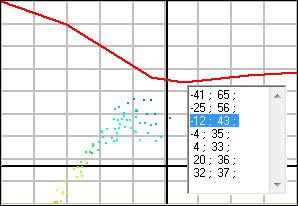
You can change the FLC coordinates by double clicking on the diagram. It will open a frame with the coordinates of the FLC and you can change it as you want. The coordinates of the FLC are saved in the file CORREL.INI.

Dipslay of the coordinates of the FLC
The Calibration and the Extra Values are reminded on the bottom of the screen.